
Index07 SEPT 202612 min
Nobody Owns the Joins: Nuclear Data and Why We Built Reactor Atlas
Every authoritative nuclear dataset measures something slightly different, at a different date, under a different definition. Reactor Atlas keeps every reading, publishes the rule that picks the headline figure, and checks the result against what regulators and grid operators publish.
- Nuclear
- Engineering
Take V.C. Summer 2 and 3, two AP1000 units in South Carolina. For the U.S. Nuclear Regulatory Commission they are a terminated licence: the combined licences issued in 2012 were withdrawn in 2019 after the owners gave notice that construction had stopped. For Global Energy Monitor they are "mothballed". For Santee Cooper, which owns the site, they are an asset it stopped building in July 2017 and has since invited bidders to acquire and finish. Three institutions, three words, and a world count of reactors under construction that moves by 2,200 MW depending on which word you pick.
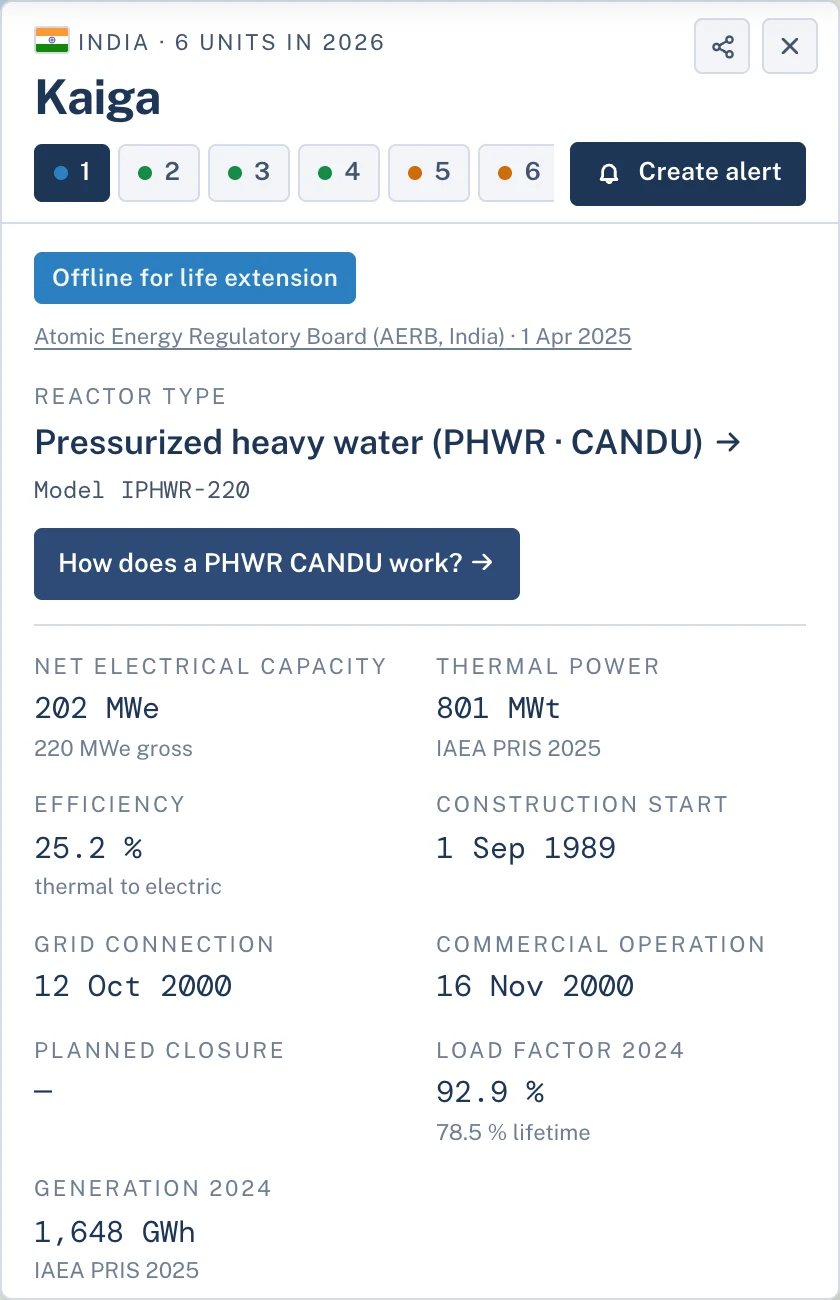
Kaiga 1, in Karnataka, has produced nothing since 1 April 2025. The regulator's own page says so: the unit is down for an eighteen-month replacement of its coolant channels and feeders. The World Nuclear Association's reactor database lists it as operable, with an operation factor of 24.6 % for 2025. The IAEA's PRIS has three states, operational, suspended operation and permanent shutdown, and moves a unit between them only when the country reports it; a refurbishment is not one of them. So the same reactor is offline to its regulator and operable to the industry's reference table, and both words are correct.
Palisades, in Michigan, closed in 2022 and is coming back: fuel loading began on 31 August 2026 under a licence the NRC amended for the purpose, and no electricity has been produced yet. Global Energy Monitor carries the return as a separate 800 MW unit with its own status line, "Unit 1 Repower", next to a retired Unit 1. The NRC treats it as the same reactor resuming operation. Count both rows and the United States gains a reactor it has already had since 1971; count neither and 800 megawatts of return disappear from every forecast.
None of these is an error. Each institution publishes exactly what it is responsible for, under its own definition, on its own calendar, and each is right by that definition. What nobody publishes is the join: the rule that decides which reading wins when two respected sources disagree, with the source and the date attached so the reader can check it. Reactor Atlas was built to publish that join. This post is about why the industry needs one and how it works.
If you run an engineering company, a fuel business, a utility desk or a regulator's technical office, you already live with this. You just may not have counted how many forms it takes.
Five ways the same fact comes out different
The first weeks of Reactor Atlas went into reconciling the IAEA's PRIS, Global Energy Monitor, the WNA, Wikipedia, the IAEA Research Reactor Database, national regulators and a dozen grid operators. Almost none of the disagreements were errors. They fall into five patterns, and every one of them is a decision someone made for a good reason.
1. Basis of measurement. Gross or net electrical output; thermal or electrical; nameplate, licensed, design or currently authorised power. Across the world fleet, almost one unit in five has a gap of more than eight percent between its gross and net figures. A 1,200 MW reactor and a 1,080 MW reactor can be the same machine. The IAEA's research-reactor database still carries the PALLAS reactor at the 25 MW registered in the database in 2010; the design under construction in Petten is 55 MW. Neither figure is a mistake. They are answers from different years to different questions.
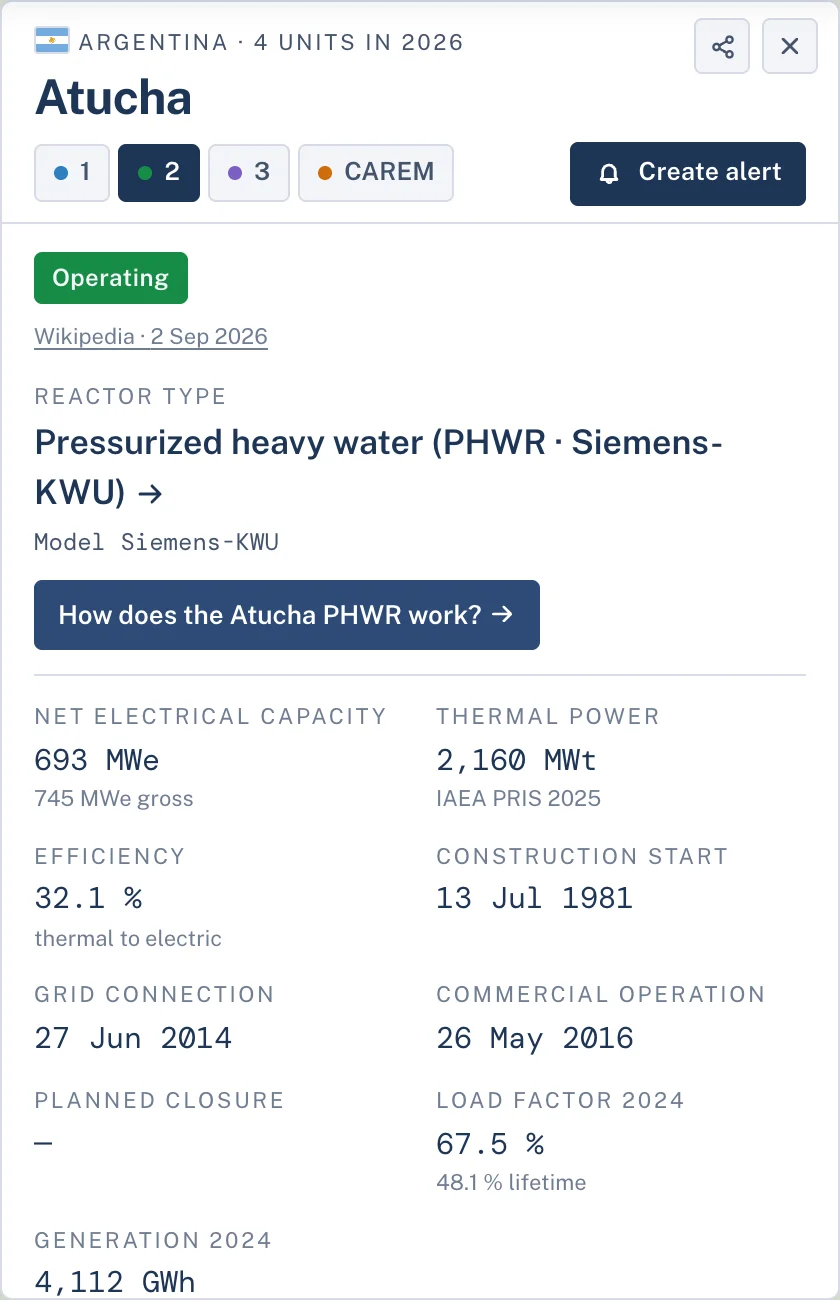
2. Criterion for "operating". The IAEA and the WNA count a unit from first grid connection. Many national tables count from commercial operation, which can come two years later: Atucha 2 synchronized in June 2014 and entered commercial service in May 2016. A unit in a long outage is "operable" to the WNA, "suspended" to some trackers and, unless the operator formally declares a suspension, "operational" to PRIS. Three sources, three sentences, one reactor.
3. Cut-off date. PRIS online reflects a grid connection within days. The printed edition that everyone quotes, the RDS-2 report, closes on 31 December: the 2025 edition describes the fleet as it stood at the end of 2024. Its companion operating-experience report (OPEX) is compiled months later and already records the 2025 closures of Doel 1 and Maanshan 2 as permanent shutdowns while the fleet table of the same edition lists them as operational. The same institution, the same year, two states for the same unit. Community sources such as Wikipedia carry a grid connection within days, with a citation; they are the freshest source and the one that most needs corroboration.
4. Granularity. Some regulators publish per unit and per day. Some grid operators publish a single nuclear total for the whole country every five minutes, from which unit states can be inferred but never read. Research-reactor databases record the "closest city" rather than the site, which puts a reactor in the centre of Sydney when it stands in Lucas Heights. Month-precision dates sit next to day-precision ones.
5. Identity. Every source names and numbers reactors its own way. PRIS numbers units site-wide; trackers number them by phase; market operators identify by balancing-mechanism unit, so one reactor with two turbines is two assets. KANUPP and Karachi, Chashma and CHASNUPP, Zaporizhzhia and Zaporozhye are the same places under different spellings. Matching them is a discipline in itself.
None of this is a scandal. It is what a mature, multinational, safety-regulated industry looks like from the outside: dozens of institutions, each publishing exactly what it is responsible for, under its own definitions, on its own calendar. The problem is not that the data is bad. The problem is that nobody has been responsible for the joins.
What it costs when the joins are left to the reader
The nuclear industry makes long, expensive decisions on short, simple numbers. A fuel supplier sizes an offer on a country's operable capacity. A component vendor plans a campaign around which units enter outage next spring. A bank prices a life-extension on the assumption that a unit is in service. A ministry compares itself with its neighbours. In each case someone opened two sources, saw two numbers, and picked one without recording why.
The visible cost is the occasional slide that gets corrected in public. The invisible cost is larger: the hours a senior engineer spends every quarter rebuilding the same reconciliation from scratch, the decisions that quietly used a gross figure as if it were net, and the operational news that reaches the boardroom a week after the regulator published it.
Reactor Atlas was built to take that reconciliation out of the reader's hands and put it under written rules.
How Reactor Atlas handles it
The platform covers the world's power-reactor fleet, 960 research reactors (291 of them operating) and 245 fuel-cycle facilities, on an interactive map with a timeline back to 1954, plus a monitoring layer that reads what regulators, operators and grid operators publish. Today that layer runs eighteen operational feeds, from the U.S. NRC and China's NNSA, CGN and CNNC to Argentina's CAMMESA, the UK's Elexon, France's RTE and EDF, KHNP, Vattenfall, Ontario's IESO, Brazil's ONS, India's CEA, Rosenergoatom, JAIF and the ENTSO-E transparency platform, giving unit or plant states, generation and event notifications for reactors in 24 countries, at the cadence each source publishes: hourly for the real-time ones, daily for the rest. Official communiqués from regulators, operators and governments come in through their own channels on top of that. Underneath, five rules decide what you see.
Every figure carries its source and its date. Each unit records which source supplied its capacity, its status and its dates. Every plant, country and research-reactor sheet closes with a line naming those sources and the most recent of their dates. A figure without a date is not a figure; it is a rumour.
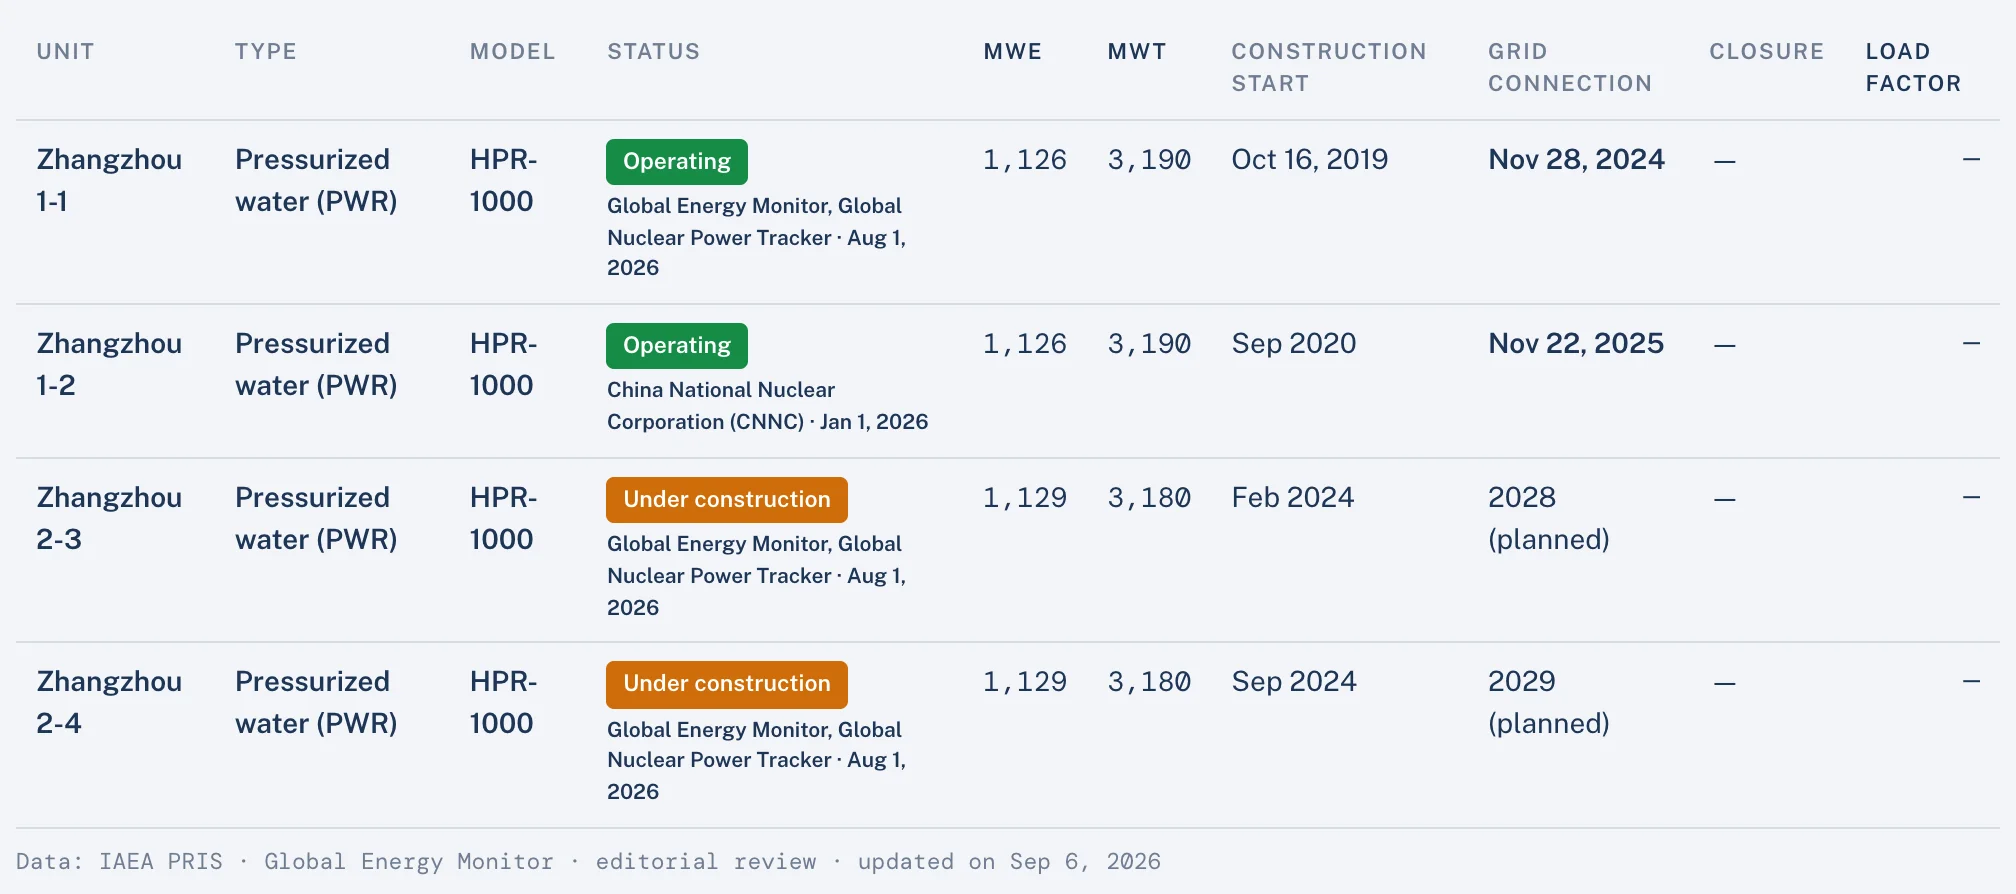
No reading is deleted. When two sources disagree, both are kept, with their source and date. Resolution is a display decision, never a data decision. The reader who wants the WNA's gross figure can have it; the reader who wants the IAEA's net figure can have it; nobody has to trust that we chose well, because the choice is visible.
The headline figure follows a written policy, per type of fact. A reading that carries an effective date outranks one that does not, regardless of the source's reputation. Status is the clearest case: it answers how a unit is right now, so the most recently dated reading wins, whoever published it. There the order of authority acts as a guard rather than a ranking, so a community edit never regresses a unit on its own, from operating to under construction, against what an official source already says. For net capacity the order does pick the winner, and IAEA PRIS comes first. Where two readings sit at the same level, the one published more recently wins, not the one we happened to consult last. Every unit sheet names the source behind its status, links to it and gives its date, so the choice is visible on the page rather than taken on trust. Changing the policy is a documented decision, not a silent edit.
Definitions are stated, not assumed. Net is the headline and gross is shown alongside it. Grid connection and commercial operation are two dates on every sheet, never collapsed into one, and the timeline states which of them it counts from. Where a figure is an estimate, it is labelled as one.
The dataset is checked against what the grid publishes, every day. This is the part no annual publication can offer. Each day the operational feeds are compared with the fleet dataset. A unit our records call operating that has not generated for sixty days, a restart whose announced date has passed, an official communiqué announcing a closure that the dataset does not yet reflect: each opens a review item with the evidence attached. It is a flag for a person, not a status change. The annual tables tell us what was true on 31 December. The grid tells us what is true this morning. The atlas holds both and knows when they differ.
The same discipline applies to the signals themselves. Grid operators publish placeholder return dates when the real one is unknown; a load-following fleet swings a thousand megawatts every noon without anyone tripping; a national operator may publish only the nuclear total. Each connector is calibrated so that a signal means one real movement of one real unit, confirmed over time, or it is not emitted. Silence is preferable to an invented outage.
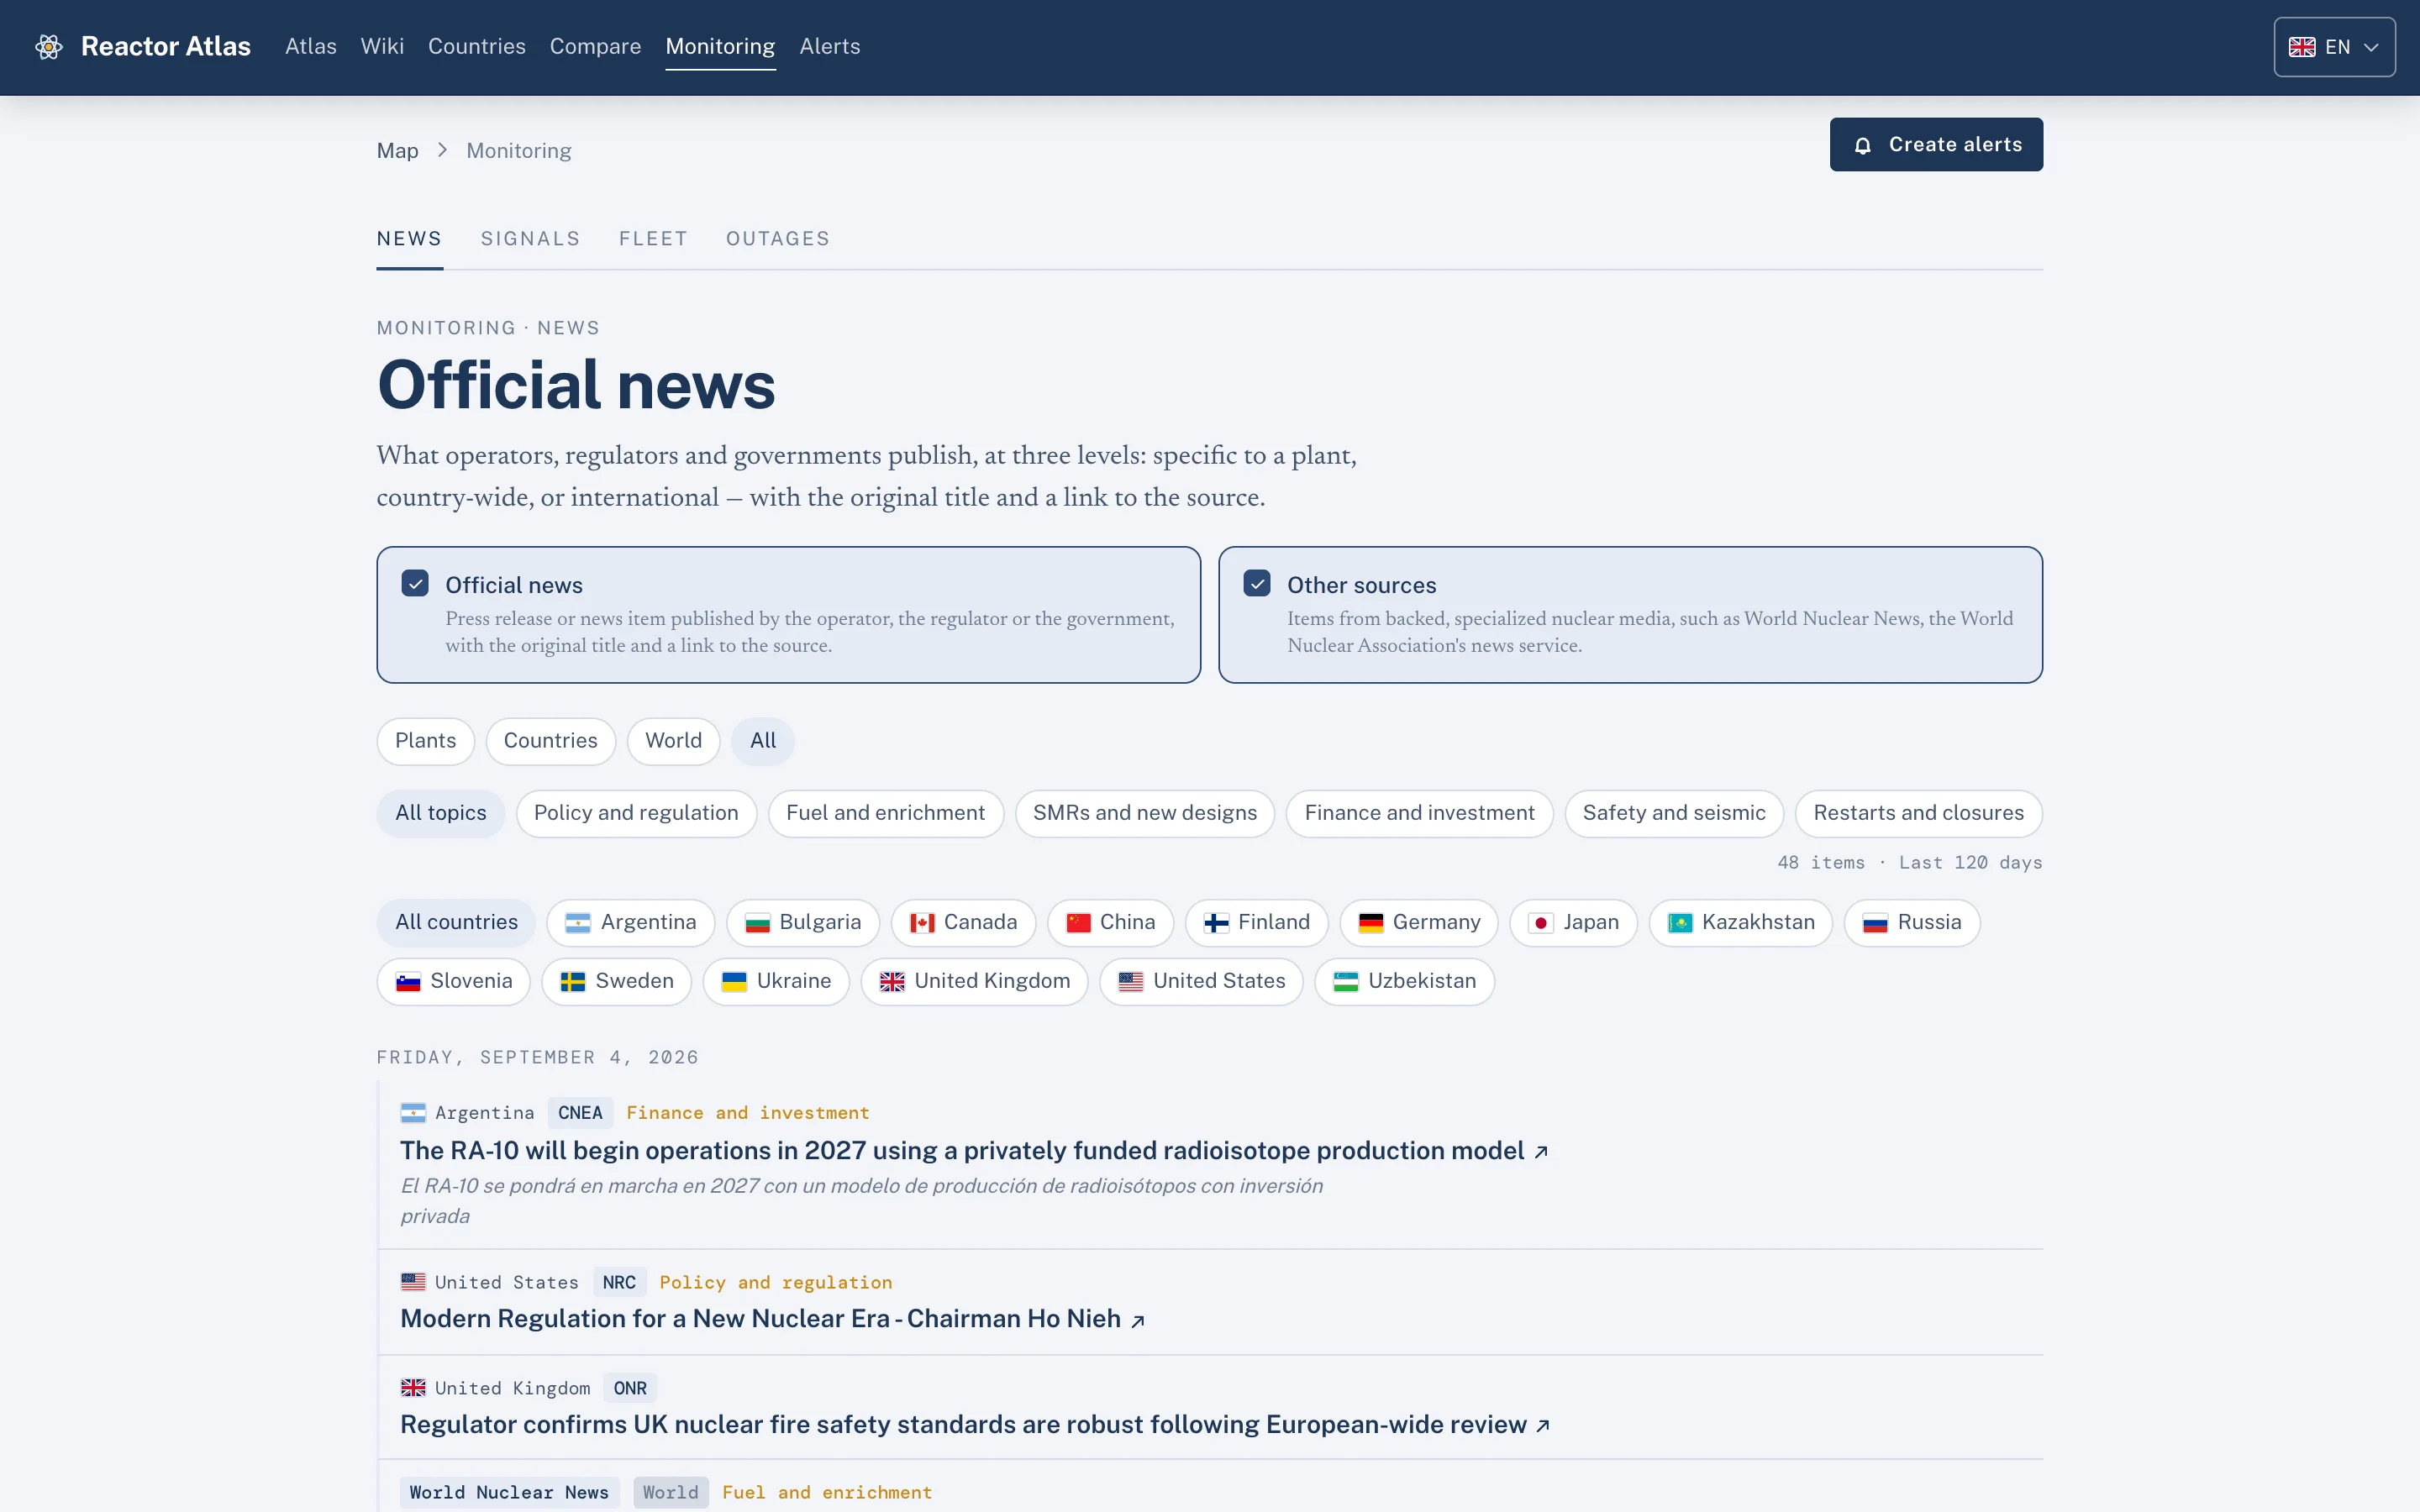
Only primary sources. The monitoring layer reads regulators, grid operators, plant operators, governments and the IAEA, from their own channels, with a link to the original document on every item. No paid feeds, no press scraping, no inference presented as fact. The status of Argentina's RA-8 critical facility rests on ARN Resolution 494/2023 as published in the Boletín Oficial; the design of Darlington New Nuclear Project unit 1 rests on the CNSC licence. Where a fact matters, the document is one click away.
What that turns into for you
For a reader who already knows the industry, the value is not the map. It is that the numbers behind the map have been argued with, one by one, under rules you can read, and that they are re-checked against the grid before you wake up.
Concretely, Reactor Atlas delivers alerts: per plant, per country or per fleet, filtered by the kind of event you care about, unplanned outage, return to service, derate, extended outage, event notification, regulatory finding, nearby earthquake, official communiqué, at the cadence you choose, immediate, daily or weekly. Latency runs from minutes to a day depending on what the source itself publishes. Each alert carries the type of event, the plant, the date, the issuing body and a link to the primary document. A real one, from the week this was written, reads like this:
PLANNED OUTAGE Heysham 2, Reactor 8: scheduled shutdown, 660 MW unavailable · refuelling · from 4 September Heysham · 3 Sep 2026 · Elexon BMRS · REMIT (United Kingdom) · View on map · Open the source
The notice behind it gives the return date, 24 November, and that is what the alert links to, not a paraphrase.
The alert builder previews, against the real events of the last thirty days, exactly how many messages your criteria would have produced, so you calibrate it before you subscribe.
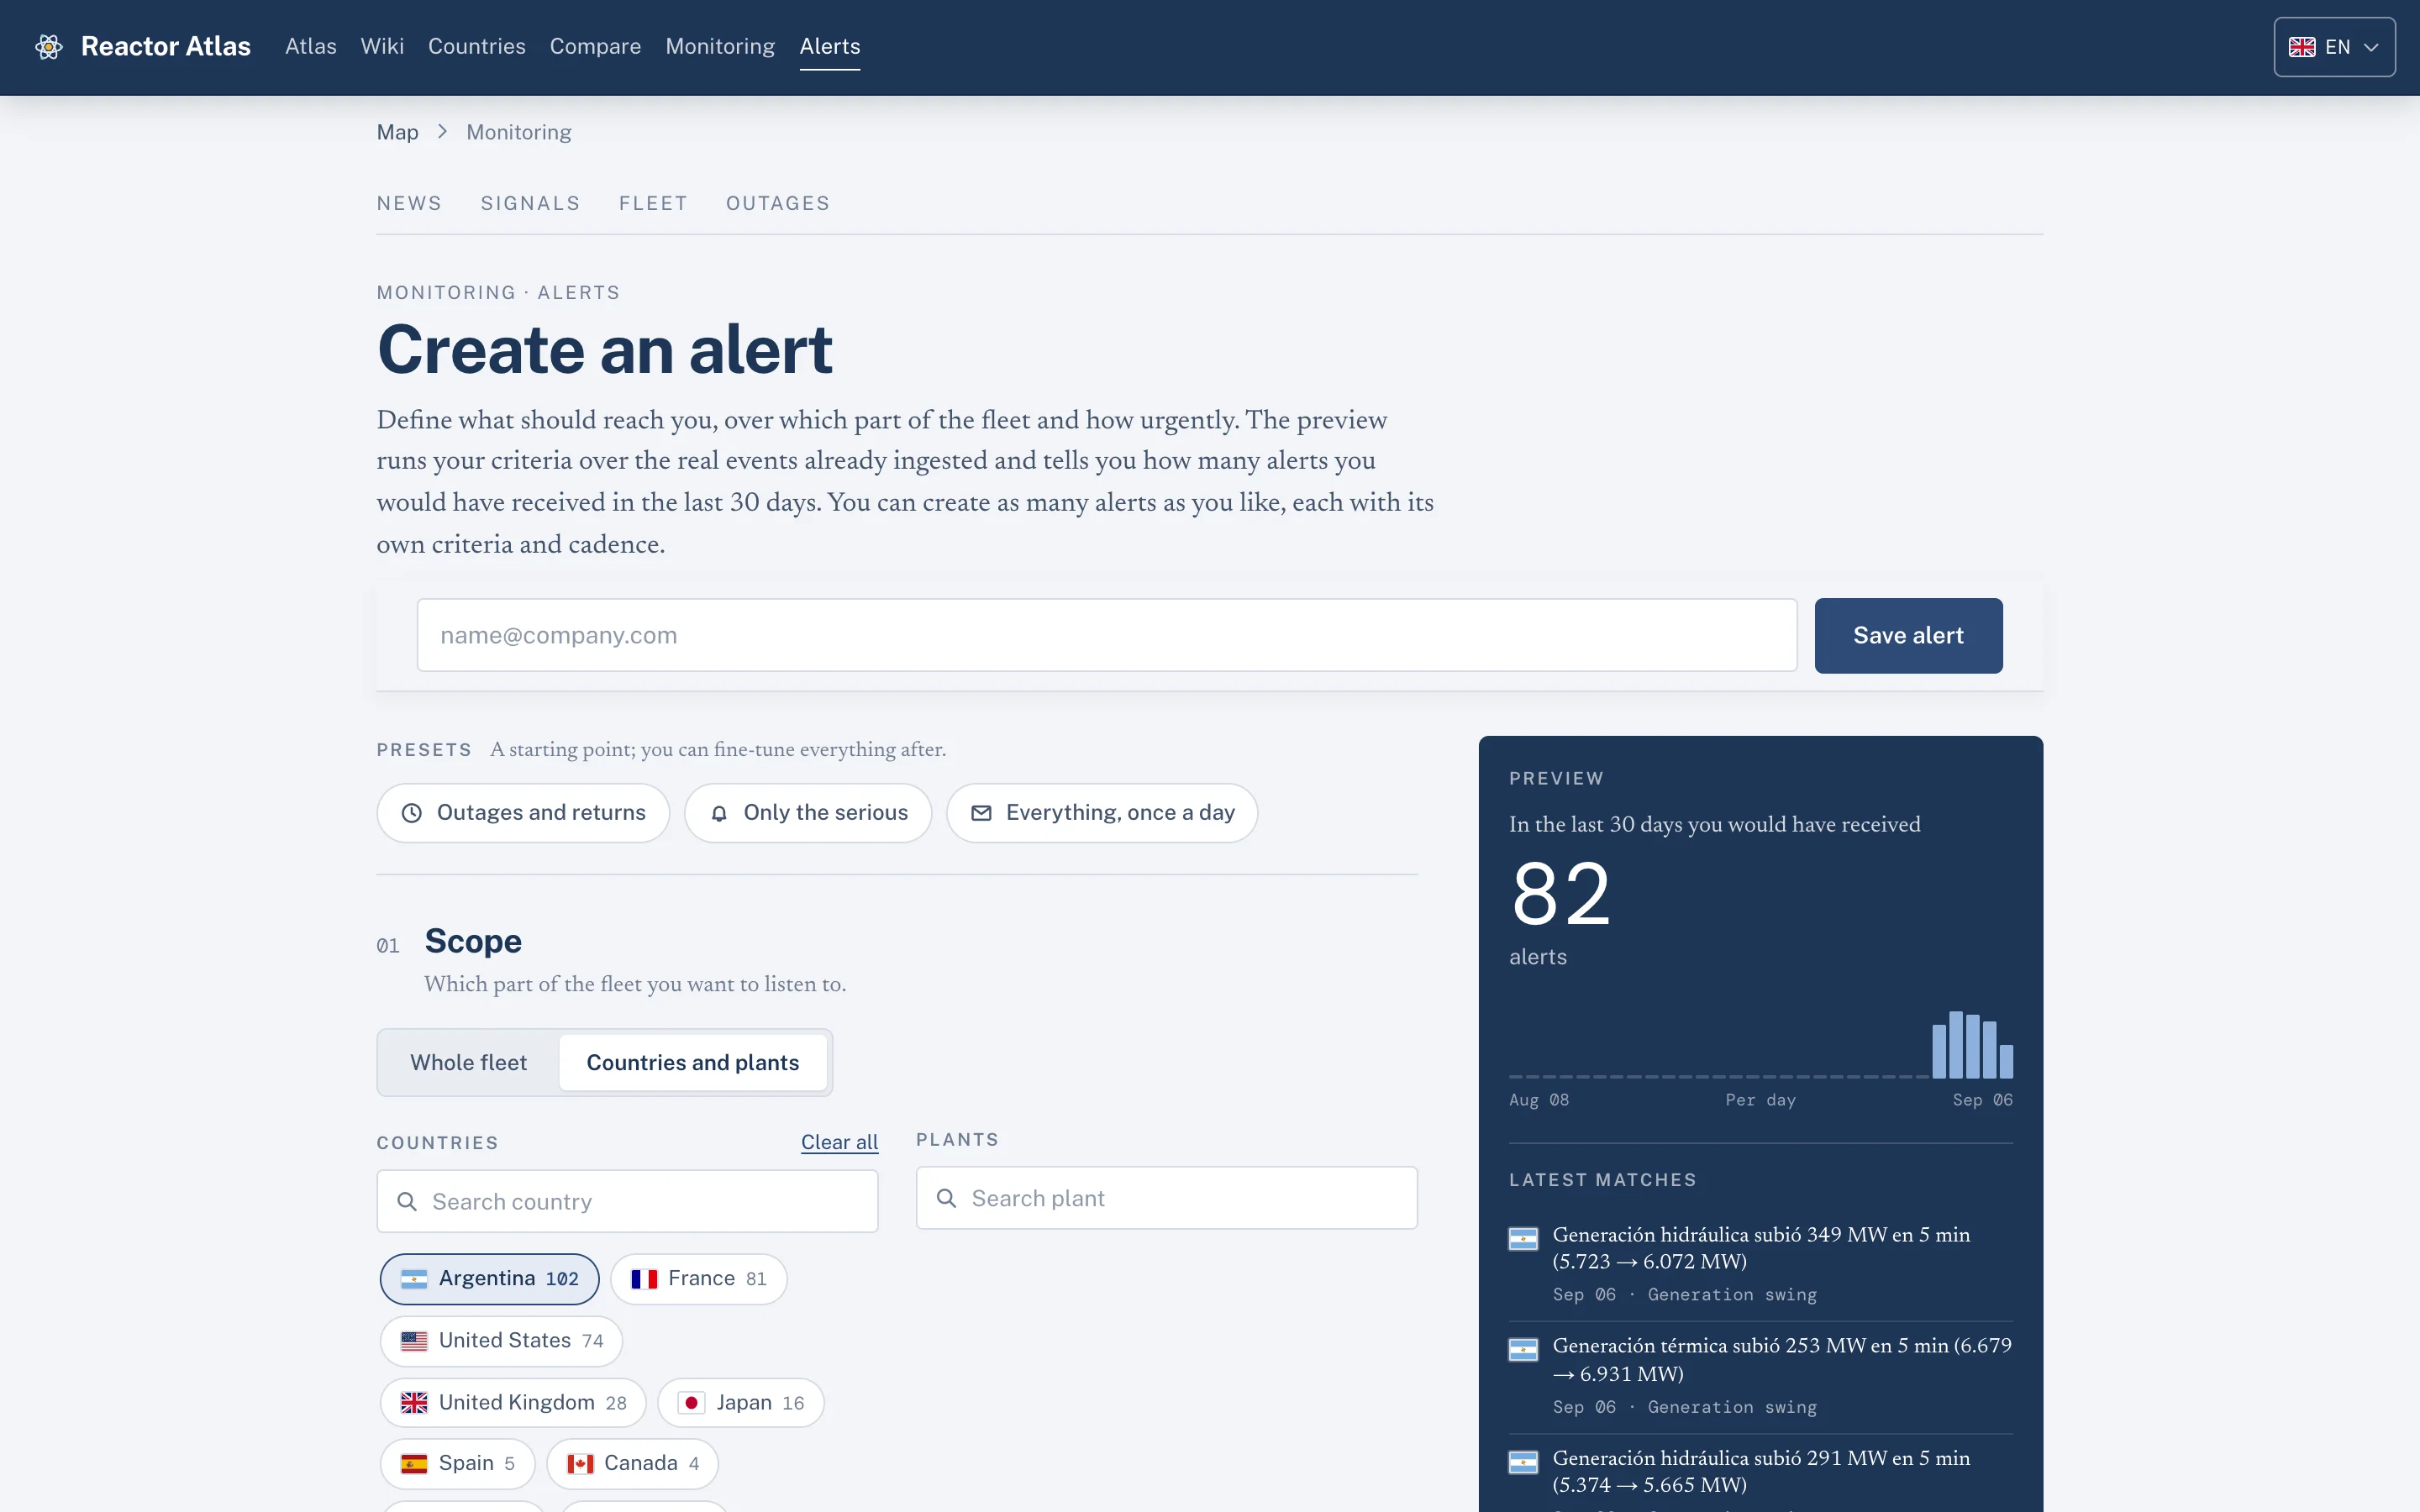
A component supplier following twelve units across four countries gets one message when any of them announces an outage window, with the operator's own notice attached. A fuel-cycle company gets the enrichment and fabrication communiqués of its competitors the day they are published. A regulator's international office gets the NRC's and NNSA's event notifications, the IAEA's INES postings and the communiqués of the regulators and operators we follow, fourteen countries today, without reading nineteen websites.
Why I built it
I come from the nuclear sector in Argentina, and the argument I have heard most often in this industry is not about physics. It is about a number. Whether Argentina has three reactors or two and a half, because Atucha 1 is offline for life extension and nobody agrees on whether "offline" belongs in the installed total. Whether CAREM, the 25 MWe prototype whose civil works stand next to Atucha, counts as capacity under construction or as a project whose schedule has stopped. Whether Atucha 3, the Hualong One unit with a signed contract and no first concrete, is a plan or a line in an agreement. Everyone in those rooms was right by the definition they were using, and the meeting ended with two spreadsheets instead of one.
The industry does not lack data. It lacks the join between its data, done once, in the open, with the rule written down and the evidence attached, so that the next meeting can start from the definition instead of ending at it.
That join is what Reactor Atlas is. The map is how you get to it.
If your organisation makes decisions on the state of the world's reactors, set up an alert on the units that matter to you, read the methodology, and tell me where our reading of a source differs from yours. That conversation is the product.
Reactor Atlas is at reactoratlas.com. Figures in this post are from the dataset of 6 September 2026.

